The GSK218MC graphic display function adopts a relatively concise way. In order to prevent the scrapping of the workpiece, the theoretical coordinate axis motion trajectory is generated from the motion information of the worktable during the trial processing of the machine tool, and then the actual motion trajectory is compared with the theoretical trajectory to monitor the processing . The graphical display rollback function is thus born. The graphic display function is described in detail below:
1. Press the graph key to enter the graph page. The page has two display interfaces: [Picture Parameters] and [+Graphics], which can be switched through the corresponding soft keys. The details are shown in Figure 1.
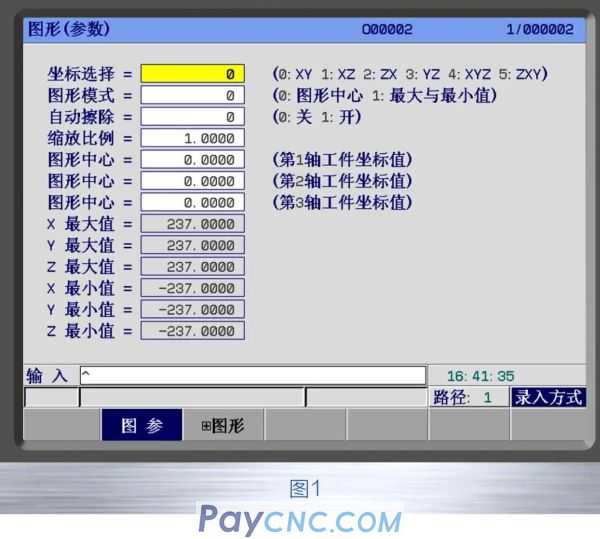
Picture parameter interface Press the soft key【Picture parameter】to enter the picture parameter interface, as shown in Figure 1.
The meaning of graphic parameters
Coordinate selection: Set the drawing plane, there are 6 selection methods (0~5), as shown in the second row.
Graphic mode: set the graphic display mode
Auto erase: When set to 1, after the program ends, the program graphics will be erased automatically when the next cycle starts.
Scaling ratio: set the scale of the drawing
Graphic Center: Set the workpiece coordinate value corresponding to the LCD center in the workpiece coordinate system.
Maximum and minimum values: After setting the maximum and minimum values of the display axis, the CNC system will automatically set the zoom ratio and the center value of the graph.
X maximum value: the maximum value in X direction in the graphic display (unit: 0.0001mm/0.0001inch)
X minimum value: X-direction minimum value in the graphic display (unit: 0.0001mm/0.0001inch)
Y maximum value: the maximum value in Y direction in the graph display (unit: 0.0001mm/0.0001inch)
Y minimum value: the minimum value in the Y direction in the graphic display (unit: 0.0001mm/0.0001inch)
Z maximum value: the maximum value of Z direction displayed on the graph (unit: 0.0001mm/0.0001inch)
Z minimum value: Z-direction minimum value in the graphic display (unit: 0.0001mm/0.0001inch)
Setting method of graphic parameters
a) Move the cursor to the parameter to be set;
b) Key in the corresponding value according to actual requirements;
c) Press the enter key to confirm
In the graphical interface, press the [+graphic] soft key to enter the graphical interface (see Figure 2)
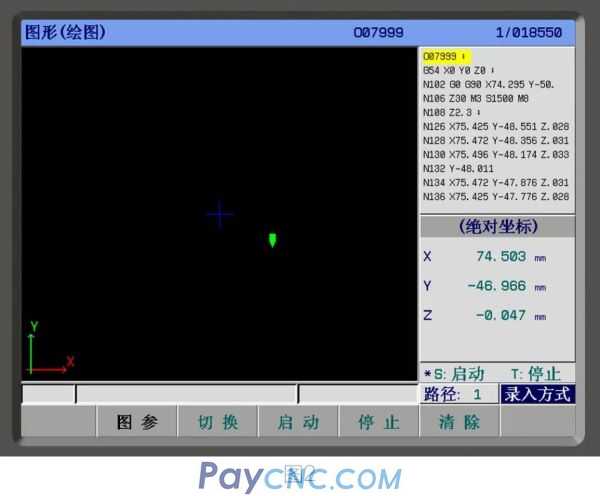
In the graphics page, you can monitor the processing track of the running program
Press [Start] soft key or S key to enter the start drawing state, at this time the "*" mark moves to S: before drawing starts;
Press [Stop] soft key or T key to enter the stop drawing state, at this time the'*' sign moves to T: before drawing stops;
Each time you press the soft key of [Switch], the graph will switch in the coordinate display corresponding to 0~5.
Press [Clear] soft key or delete key to clear the drawn graph.
2. Concluding remarks
Through the above description, you can quickly understand the graphic display function and effectively provide an intuitive and concise display interface. This function will be in the graphic page to monitor the processing trajectory of the running program, so as to ensure the stability of processing and debugging.
|
 |
| Products Catalogue | Home | About Us | Retrofit | Download | News | Tech Support | Contact Us | |
|
|
|